.webp)
.webp)
.webp)
.webp)


Most PI firms can tell you how many cases are open, but that number doesn't explain which files haven't moved, what's holding them up, or where staff workload is starting to affect case progress. Leadership needs those answers because an active case can still be operationally stuck.
A plaintiff law firm dashboard should make those conditions visible without forcing managers to open matters one by one. That means tracking intake conversion, case stage, stage aging, case velocity, demand readiness, outstanding records, settlements, fees, expenses, workload, client communication, deadlines, and marketing ROI. Because contingency firms earn when cases resolve, those metrics need to connect case movement with outcomes and fees rather than simply describe activity.
Traditional legal KPIs still have a place, especially when management needs to understand staffing and time allocation. However, utilization, realization, and collection don't show whether a treatment-complete case has been waiting three weeks for records or whether a ready demand still hasn't been drafted. Plaintiff firms therefore need operational metrics that show where cases are slowing down early enough for leadership to act.
Leadership shouldn't have to open hundreds of matters to find the handful that need attention. These 12 metrics cover intake, case movement, financial performance, workload, and client service, and each one should lead back to the cases or people behind the number.
Metric | What It Tells You |
Intake conversion rate | How effectively qualified leads become signed cases |
Cases by stage | Where the caseload currently sits |
Case aging | Which matters or stages may be drifting |
Case velocity | How quickly matters move between meaningful stages |
Case readiness | Which files are prepared to move forward |
Outstanding records and bills | Where medical evidence is blocking progress |
Demand pipeline | Whether cases are reaching negotiation consistently |
Settlement metrics | Outcome and cycle-time trends |
Firm fees and expenses | Financial performance of resolved matters |
Projected revenue | What may convert to fees in the near term |
Team workload and overdue work | Capacity and operational bottlenecks |
Client communication and engagement | Where service or information gaps need attention |
A mature dashboard can add marketing ROI, SOL exposure, cost per signed case, AI usage, and estimated time savings. Add them only when they lead to a decision.
Intake conversion rate measures the percentage of qualified prospective clients who become retained cases:
Signed cases ÷ qualified leads × 100
Raw inquiry volume can distort performance because a campaign that produces 500 calls and 10 retained cases may be less valuable than one that produces 80 qualified inquiries and 25 signed matters. Track conversion by source, office, case type, and intake employee, then compare those segments with cost per signed case and eventual fee generation so the dashboard reflects case quality as well as lead volume.
CASEpeer currently reports conversion, retention, referral-source, and marketing ROI metrics. If conversion drops, leadership should inspect response time, lead quality, lost-lead reasons, and retainer completion before blaming intake performance.
Cases by stage shows where the firm's active work is concentrated. Typical stages include intake, investigation, treatment, records collection, demand preparation, negotiation, litigation, settlement, lien resolution, and disbursement.
The number becomes useful when the distribution is uneven. If 180 of 500 active matters are waiting for records while only 20 are in demand preparation, the bottleneck may be evidence collection rather than total caseload. Leadership can then focus on the records workflow instead of hiring more staff without knowing where capacity is actually constrained.
Case aging measures how long a matter has remained open or how long it has remained in a particular stage. Overall age is useful, but stage aging is often more actionable because an older litigation case may be progressing normally while a newer pre-litigation file has been waiting 90 days for one missing bill.
Track median days in stage, oldest cases in each stage, and matters above the firm's own target range. Use those exceptions to ask what is blocking movement, then assign the next action instead of using age as a performance score by itself.
Case velocity measures how quickly matters move between meaningful stages of the plaintiff workflow. Useful transitions include treatment complete → records complete, records complete → demand sent, demand sent → first offer, first offer → settlement, and settlement → disbursement.
Two firms can each have 500 active cases while operating very differently. If one firm moves files steadily and the other has 150 cases with no meaningful stage change in three months, raw caseload hides the problem. Track velocity by case type and stage so leadership can see where delays occur and whether process changes actually shorten them.
Case readiness shows whether a matter has the verified information needed to move to its next stage. For a pre-litigation PI case, that may include treatment status, providers, medical records, bills, imaging, liability evidence, wage-loss documentation, liens, client updates, and attorney review.
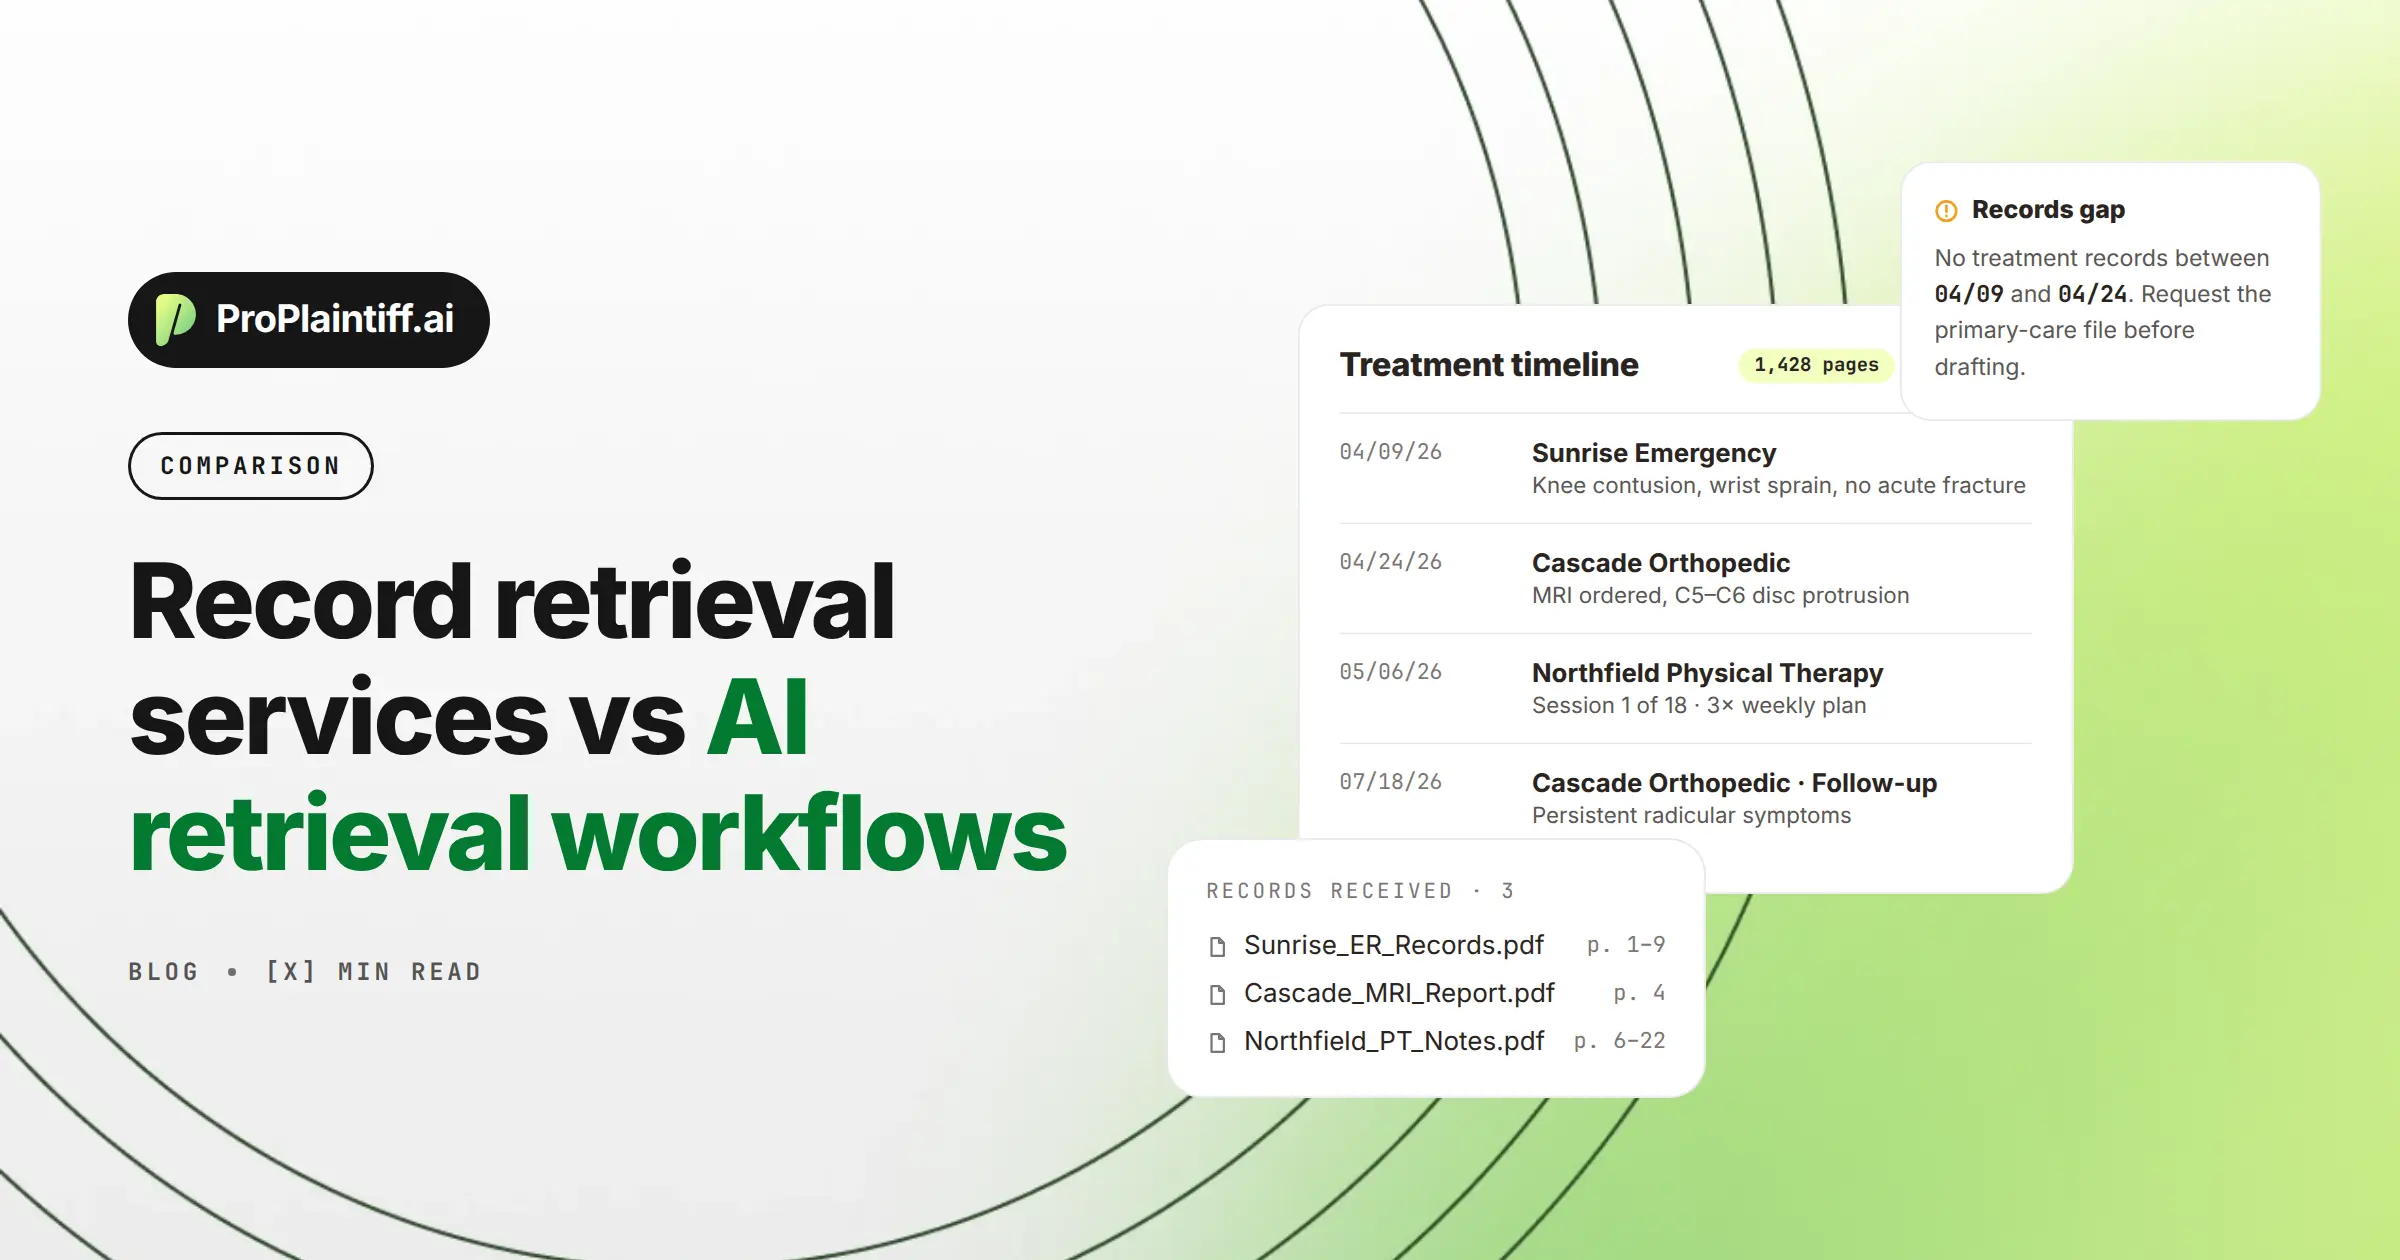
Case readiness is most useful when it answers "What is preventing this case from moving forward?" ProPlaintiff's current case-readiness guidance ties readiness states to specific actions, so a missing record can trigger retrieval while a strategy issue routes the file for attorney review. The dashboard then shows both the blocker and the next step instead of adding another status label for staff to interpret.
Medical evidence often controls PI case velocity, so records and bills deserve their own exception view. Track open requests, average days outstanding, requests beyond follow-up thresholds, incomplete productions, missing bills, missing imaging, missing providers, and records that arrived but haven't been reviewed.
Leadership shouldn't have to inspect 187 open requests individually because most of them may be progressing normally. The dashboard should isolate the subset waiting on a provider fee, missing a date range, rejected for authorization, or overdue for follow-up, so staff can work the exceptions while routine requests continue without management attention.
The demand pipeline shows which cases are becoming negotiation-ready. Track demand-ready matters, demands in preparation, demands sent, time from treatment completion to demand, insurer response status, first offer, current offer, and negotiated settlement.
A useful metric is treatment complete → demand sent because it exposes the work between a medically mature file and a negotiation package. If that interval grows, inspect records, chronology review, damages documentation, and drafting. ProPlaintiff's analytics keeps demand activity beside cases, financials, tasks, and AI usage.
Settlement reporting should show both outcomes and timing. Useful measures include settlement total, median and average settlement, time to settlement, firm fee, client net, settlement by case type, referral source, attorney, and litigation stage.
Don't use average settlement as a standalone attorney ranking because case mix can change the number dramatically. Segment outcomes by meaningful case characteristics, then use the trends to understand portfolio performance rather than turning one figure into a quality score.
Financial reporting should connect case costs to the fees and proceeds generated by the matter. Track expenses advanced, recovered and unrecovered costs, firm fees, client net, referral or fee splits where relevant, settlement proceeds, and case profitability if the firm can allocate costs consistently.
A large gross settlement doesn't automatically mean the case was operationally efficient because the result may have required unusually high acquisition costs, case expenses, or staff time. A more useful resolved-case view therefore includes:
Firm economics = fee revenue − unrecovered case costs − attributable acquisition and operating costs
Use the calculation consistently across comparable case types so leadership can identify which workflows consume disproportionate resources.
Projected revenue helps contingency firms plan around irregular cash flow. The useful inputs aren't every active case's theoretical value, but matters closer to conversion: outstanding demands, negotiated cases, settlements awaiting funding, matters waiting on lien resolution, expected firm fees, and pending disbursements.
Treat the number as a forecast rather than guaranteed revenue. CASEpeer, for example, reports that administrators can view demand, offer, pending-funds, and projected-income pipelines. Firms should use similar stage-based forecasting and adjust assumptions as matters move, rather than presenting speculative case values as booked revenue.
Workload metrics should identify capacity problems, not create an employee surveillance board. Track active cases per attorney or case manager, open and overdue critical tasks, average turnaround on repeatable work, unassigned tasks, approaching deadlines, and cases with no recent activity.
Task volume needs context because 150 small administrative completions aren't directly comparable with 20 complex litigation assignments. Ask where workload is slowing cases or creating risk, then rebalance ownership or redesign the workflow before interpreting the metric as individual performance.
Client communication is both a service and operational metric because missing updates can lead to status calls, lost treatment information, complaints, and weaker referrals. Track last meaningful contact, overdue updates, unanswered messages, outstanding client documents, treatment updates, and portal engagement where available.
If 18 clients haven't received an update within the firm's policy window, route those matters to the assigned team members instead of waiting for clients to call.
Marketing should be measured through the entire path from spend to retained case and, eventually, fee generation. Start with spend, leads, cost per lead, and referral source, then add qualified leads, conversion rate, signed cases, and cost per signed case.
The final layer is case quality and economic return. Compare source-level fees or attributable revenue against acquisition spend, but segment by case type and maturity because newer campaigns may not have enough resolved cases to judge fairly. CASEpeer's reporting currently connects referral and lead-source data with conversion and marketing ROI, which is the direction plaintiff firms should take rather than optimizing around cheap leads alone.
Sometimes, but billable hours should rarely be the central KPI for a contingency-based PI practice. Time data can still help when the firm handles statutory-fee matters, mixed-fee work, or wants to understand how much staff capacity different case types consume.
Traditional utilization, realization, and collection metrics describe the economics of billing time, whereas contingency practices earn when cases resolve. Use time as a resource-consumption measure, then connect it to case movement, outcomes, fees, and cycle time so the firm can see whether additional effort produces additional value.
AI adoption only matters if it changes the work. Track AI-assisted demands, chronologies, documents, records analyzed, automations executed, active users, review or correction rates where measurable, cost per workflow, and estimated staff hours saved.
Then connect those measures to shorter drafting time, reduced manual review, faster movement to demand, or greater staff capacity. ProPlaintiff's Analytics includes firm and lawyer views, AI usage, feature adoption, and time-savings reporting. If usage rises without operational improvement, inspect where AI output still requires manual correction or duplicate work.
Lagging indicators describe results that have already happened: settlements, fees collected, cases closed, revenue, and acquisition cost. They matter because leadership needs to know how the firm performed.
Leading indicators expose problems or opportunities before the outcome arrives. Examples include cases stuck in a stage, overdue records, treatment completed without a demand started, overdue client contact, approaching SOLs, growing caseload per staff member, and demand-ready volume. A healthy dashboard needs both because settlement revenue explains the past while readiness and stage movement help leadership act on what may happen next.
The managing partner view should stay small enough to read in a few minutes. Include new leads, intake conversion, active cases, cases by stage, stalled cases, demand-ready cases, demands sent, settlements, expected firm fees, case expenses, overdue critical tasks, and SOL or deadline risk.
Each number should drill into the underlying matters. If the dashboard shows 27 stalled cases, the next click should reveal which 27, why they're stalled, and who owns the next action.
Intake managers need metrics that explain speed, conversion, and source quality: inbound leads, response time, qualified leads, retainers sent, signed cases, conversion rate, lost-lead reasons, referral sources, staff conversion, and time from first contact to signed retainer.
Use the data to improve the handoff. If response time is strong but conversion falls, review lead quality and lost-lead reasons before changing staffing levels or scripts.
Case managers need a working queue rather than a high-level financial dashboard. Track assigned caseload, stage, treatment status, providers, outstanding records and bills, last client contact, next action, overdue tasks, readiness, and approaching deadlines.
Prioritize exceptions at the top. A case that's healthy and moving should require less attention than one with a missing MRI report, no client contact, and a demand target date approaching.
Firm owners should monitor the settlement pipeline, settled cases, gross settlements, fees generated, case costs, projected fees, pending disbursements, client net, acquisition cost, and revenue by referral source.
Higher settlement volume can still create cash-flow pressure if lien resolution or funding delays keep fees from reaching the firm, so preserve the stage between settlement and actual disbursement.
Every warning should suggest a response. "41 overdue records requests" is more useful when users can open those matters, see the reason, and assign follow-up.
Operational dashboards should reflect current case activity rather than last month's spreadsheet export. ProPlaintiff's analytics and report-builder tools are designed around current case, task, document, deadline, expense, and invoice data.
Leadership should be able to move from a firm-level number to the matters producing it because an aggregate only identifies the symptom. Drill-down shows which cases, teams, or stages created the result, so the dashboard doesn't become another reporting silo that still requires staff to reconstruct the answer elsewhere.
Firm owners, intake managers, case managers, and attorneys need different views because they make different decisions. Give each role the smallest set of metrics that supports its responsibilities.
Targets should reflect the firm's case mix, staffing, geography, and historical performance. Universal benchmarks are less useful when they ignore the operating model behind the number.
A KPI becomes more actionable when users can reach the case, documents, tasks, and owner behind it. That connection shortens the path from noticing a problem to correcting it.
A practical PI dashboard might show:
124 leads | 38 signed | 30.6% conversion
412 active cases: 128 treatment, 71 records, 54 demand preparation, 62 negotiation, 97 litigation.
22 stalled cases: 9 missing records, 5 overdue client contacts, 4 with no next task, and 4 approaching a critical deadline.
34 demand-ready | 21 sent this month | 12 awaiting insurer response
Settlements this month | projected fees | case expenses | pending disbursements
41 overdue tasks | 6 cases without meaningful activity for more than 30 days
The figures are illustrative rather than benchmarks because every firm's caseload and staffing model differ. What should remain consistent is the action layer: each exception should lead to an owner, a next step, or a reason no action is required.
Different metrics need different review cadences because SOL risk and quarterly marketing ROI carry different urgency.
Review critical deadlines, SOL risk, urgent intake, and overdue high-risk tasks so the team can correct time-sensitive problems immediately.
Review case movement, records backlog, demand pipeline, workload, client-contact backlog, and intake conversion because these operational trends can drift quickly enough to affect monthly results.
Review settlements, firm fees, marketing ROI, acquisition cost, case cycle time, financial trends, and AI adoption. Use the longer period to separate sustained patterns from weekly variation.
Review profitability, staffing capacity, case mix, technology ROI, marketing allocation, and workflow redesign. These decisions require enough data to justify changes in budget or operating structure.
A dashboard with dozens of equally prominent widgets makes exceptions harder to see. Keep the executive view small and move diagnostic detail into drill-down reports.
"Emails sent," "tasks created," and "AI prompts used" show activity but not operational value. Prefer clients overdue for contact, overdue critical tasks, case-cycle changes, or hours of manual work reduced.
Firm-wide numbers can hide meaningful differences between case types, offices, referral sources, attorneys, and stages. Segment before drawing conclusions from an average.
Complex casework requires context. Use workload and performance data to identify support needs, bottlenecks, and process problems rather than turning one metric into a league table.
Settlements and revenue explain what already happened. Add leading indicators such as case readiness, stage aging, demand pipeline, and deadline exposure so leadership can intervene before the outcome is fixed.
If leadership needs half a day of spreadsheet assembly before it can understand firm performance, the reporting workflow is consuming capacity before management even begins. Automate recurring reports or connect the dashboard directly to the case system so the same data doesn't have to be rebuilt repeatedly.
ProPlaintiff fits PI firms that want reporting connected directly to cases, tasks, financial activity, and AI workflows. Its current Analytics product includes firm and lawyer views for case activity, financial outcomes, tasks, documents, AI usage, and settlements, while its Report Builder can use cases, contacts, deadlines, expenses, invoices, and other operational data.
That connection matters because leadership can move from a KPI to the underlying matter without exporting the caseload into another spreadsheet first. If the dashboard shows a records backlog or demand delay, the team can identify the affected cases and assign the next action inside the same operating environment.
Firms replacing monthly spreadsheet assembly should test the dashboard with their own stages, bottlenecks, and reporting questions. See how ProPlaintiff connects case management and firm analytics, then confirm that the data leads directly to the underlying cases and next actions.
A law firm dashboard should include case, financial, client, workload, and risk metrics that lead to decisions. Plaintiff firms should emphasize intake conversion, stage movement, case aging, demand readiness, settlements, fees, expenses, deadlines, records bottlenecks, and workload.
Core PI KPIs include intake conversion, cost per signed case, cases by stage, stage aging, case velocity, demand readiness, settlement cycle time, firm fees, case expenses, workload, client-contact compliance, and marketing ROI. Set targets from the firm's own segmented historical data.
For a plaintiff firm, productivity should combine case movement, turnaround time, critical work, caseload, quality, and outcomes. Task volume alone can mislead because matters require different effort, so inspect the underlying cases before evaluating performance.
Case velocity measures how quickly a matter moves between meaningful stages, such as treatment completion to records completion or demand sent to settlement. It helps leadership see where cases slow down even when total active caseload remains stable.
Case aging measures how long a matter has remained open or how long it has remained in a specific stage. Stage aging is often more actionable because it can reveal a file stuck in records collection or demand preparation even when the overall case age isn't unusual.
Start with fees generated, case expenses, unrecovered costs, acquisition cost, resource consumption, and time to resolution. Compare similar case types and stages because a high settlement doesn't automatically mean the matter produced strong economics after costs and staff effort are considered.
They can be useful for statutory-fee matters, mixed-fee practices, or resource analysis, but they shouldn't be the only productivity measure for contingency work. Connect time to case movement, outcomes, cycle time, and fees so leadership can understand how staff capacity is being used.
Yes. AI-enabled case-management systems can consolidate case activity, surface bottlenecks, generate reports, and measure workflow or AI adoption. The firm should still judge the technology by outcomes such as reduced manual work, faster case movement, or improved capacity rather than treating higher AI usage as success by itself.

Agentic case management platform designed to streamline the work of law firms.


Join our Newsletter
Welcome to ProPlaintiff!
Oops! Something went wrong, please try again


.svg)